Guides & Tutorials
How fast should your website be in 2023?

Emil Rasmussen
CTO at Enterspeed

We're often asked how fast a website should be.
Awesome question, we think. And one we’re happy to answer.
But beware… The answer is a smidge complicated. Let's throw a few metrics at you, though. You can use them as a guideline when you evaluate a website. As part of the package we'll also provide a bit of knowledge you can put into actual use.
Before we get into the concrete numbers, we want you to keep in mind that performance should be seen in relation to the business. As a rule of thumb, a faster website means better business. Don’t just optimise the performance for the sake of better performance, optimise your website’s performance to create a better business.
The easiest way to gauge if a performance optimisation is worth the effort, is to compare your website to your competitors’. And if you want to stand out on performance, you should set a goal to be 20% faster than your fastest competitor.
But let’s get to it and check out the 10 most important website performance metrics for 2023.
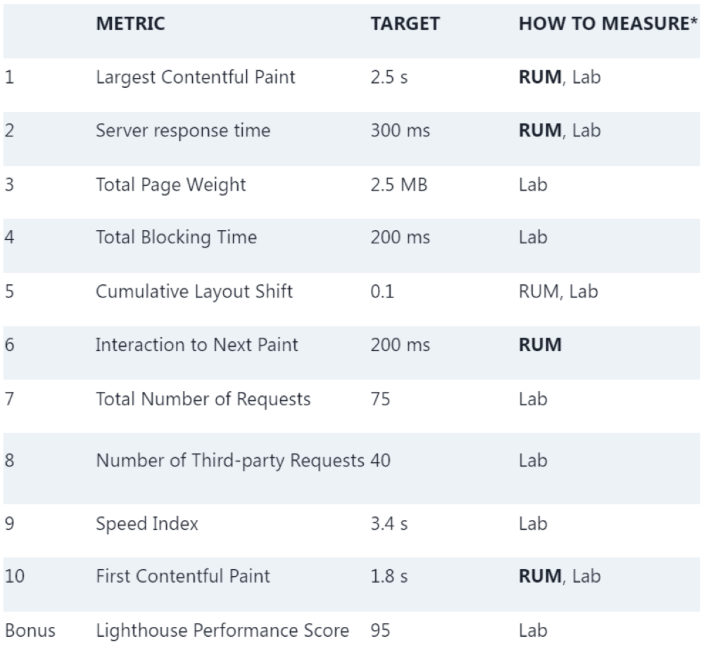
RUM = Real User Monitoring (aka. field data)
Lab = Laboratory testing and not real users (aka. Synthetic testing)
Bold = recommended measuring technic
We’ve organised the list, so you’ll learn the most from the first 2 or 3 points and then you'll get more and more details into your performance optimisation work.
The Largest Contentful Paint (LCP) is the most important metric for how fast your website loads. If you only track one metric, this is the one.
The recommended target for LCP is 2.5 seconds for the 75th percentile.
The LCP is part of Google’s Core Web Vitals and is a user-centric performance metric. User-centric performance metrics aim to quantify the user’s experience of the website’s performance. The LCP measures the time from when the user requests the page until the most important visual element (text or media) is presented to the user.
Understanding how you measure the LCP is crucial when you interpret the result. The recommended target of 2.5 seconds should be what the majority of your users experience. We recommend that you follow Google’s definition and define the 2.5-second goal for the 75th percentile.
The recommended strategy for measuring the LCP is to monitor and collect the performance measurements from your actual users using a Real User Monitoring (RUM) tool.
We need to note that even though LCP has been a performance metric for a few years, it is currently only available in Chrome-based browsers.
A low server response time is a prerequisite for all other metrics. If the content is not delivered to the users in a timely fashion, then you don’t have a chance.
The recommended target for server response time is 300 milliseconds for the 75th percentile.
The server response time – also known as the time to the first byte (TTFB) – is perhaps the oldest metric in the field of web performance. It’s simply a measurement of how fast the page is served to the user, but many factors come into play when measuring and optimising server response times.
The most important factor for server response time is usually the web application serving the pages, often the CMS, but the geographical location of the users can also affect server response time quite considerably.
Our recommended target of 300 ms is an aggressive target, but since the server response time is the foundation that everything else depends upon, this is not where you want to be lax. Over the years, the recommended server response time metric has changed. In 2019 the definition of a “fast” website used by the 2019 HTTP Archive Web Almanac was 200 ms. Up till early 2022 Google’s target for labelling the server response time as “good” was 500 ms, and currently the threshold is 800 ms. Due to the many factors affecting server response time and real-world web performance in general, we believe that a 300 ms is an ambitious yet realistic rule of thumb target across devices and geography.
The recommended strategy for measuring the server response time is to monitor and collect the performance measurements from your actual users using a Real User Monitoring (RUM) tool. Having RUM data from the field is especially important for server response time, due to many factors that affect this for the specific user.
This is a metric that simply measures how much data the user needs to download when viewing your page. The total page weight is a very good indicator of the performance of a web page.
The recommended maximum for total page weight is 2.5 MB.
There is a strong correlation between the amount of data a user must download and how fast the page loads, but the actual impact on performance depends on the user’s type of connection and the capabilities of the user’s device. This is a metric where you could choose to have different goals for mobile and desktop users.
The recommendation of one goal of a maximum of 2.5 MB is based on two data points. Firstly, the HTTP Archive states that the median desktop webpage is 2393.8 KB, while the median for mobile webpages is about 10% lighter with 2095.4 KB (May 2023). Secondly, Google’s Lighthouse begins to warn about "enormous" page weight at 5 MB. So, targeting something around the median and in safe distance from Lighthouse’s warnings 2.5 MB is a good target.
The simplest way to evaluate the total page weight is to use the developer tools in the Chrome browser.
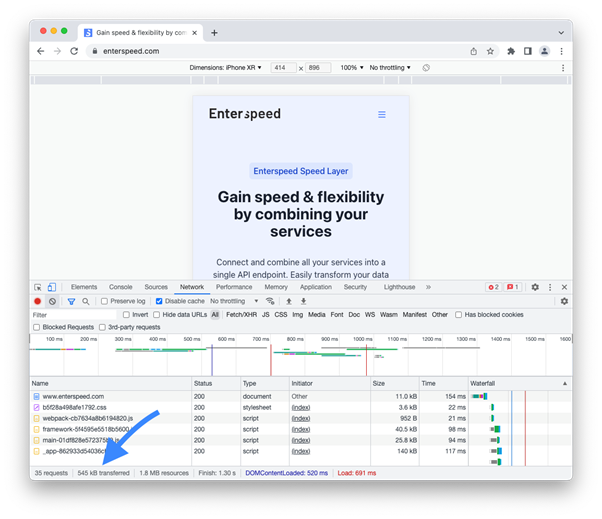
Chrome Developer Tools show how much data is transferred. But we recommend that you use a performance monitoring service that regularly visits your website to continuously monitor the page weight.
20 years of experience with web technology and software engineering. Loves candy, cake, and coaching soccer.
© 2020 - 2026 Enterspeed A/S. All rights reserved.
Made with ❤️ and ☕ in Denmark.